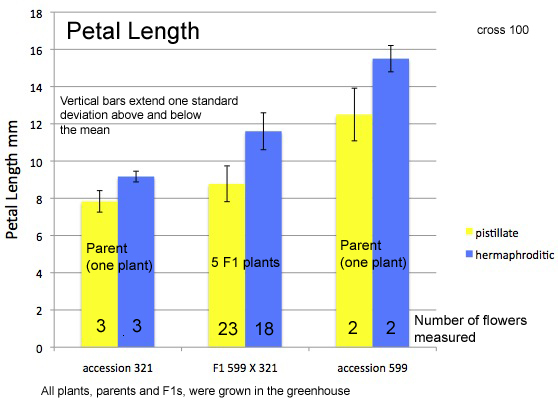
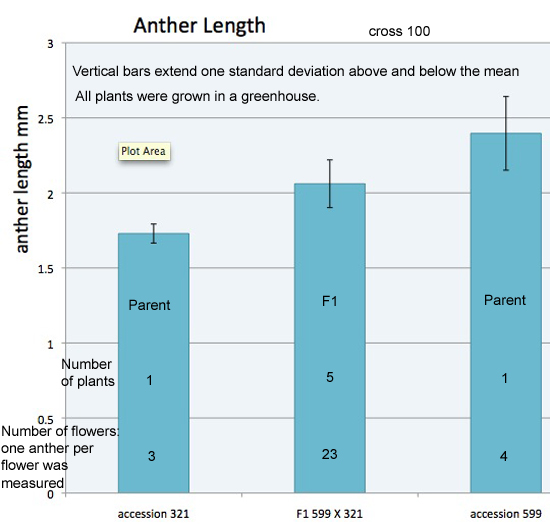
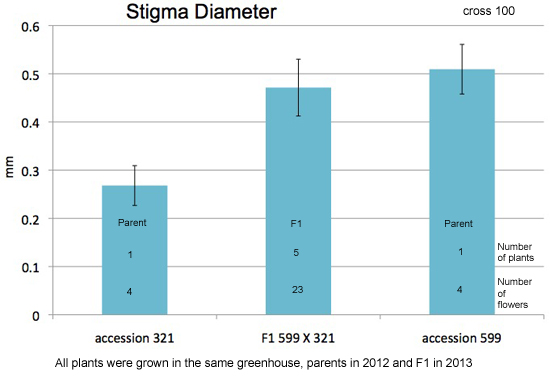
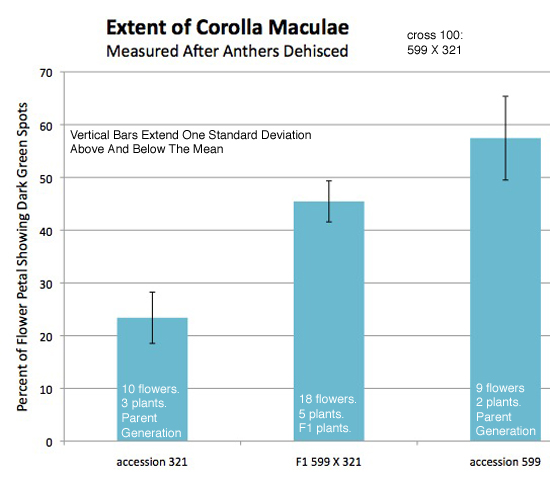
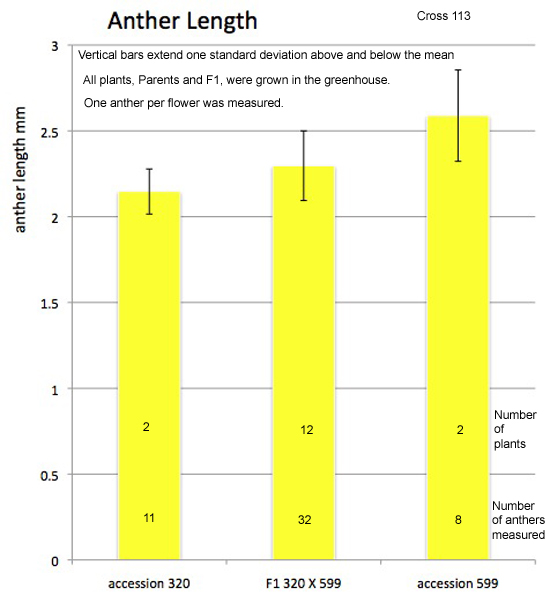
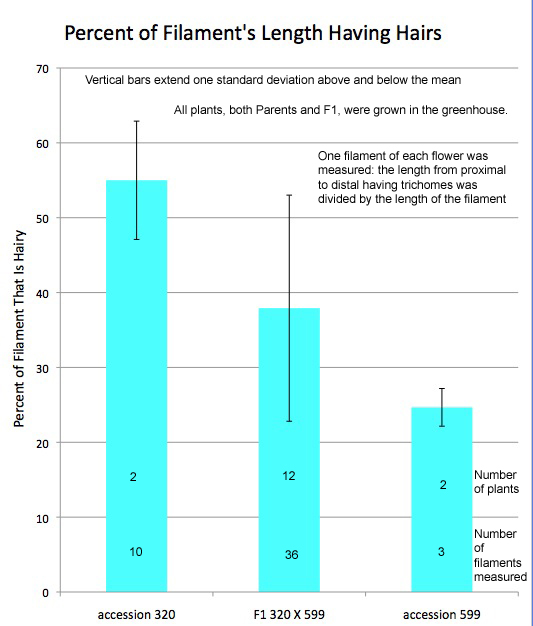
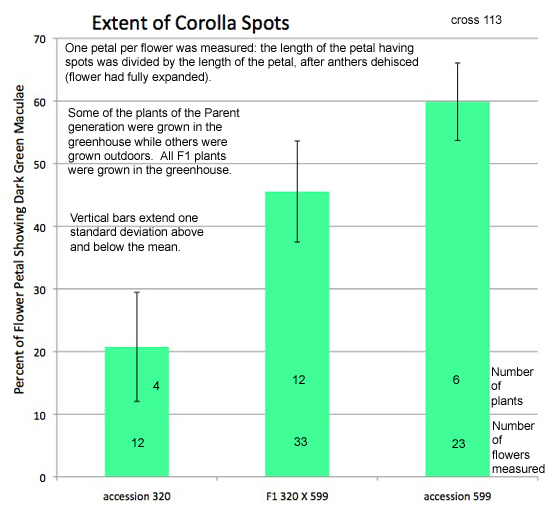
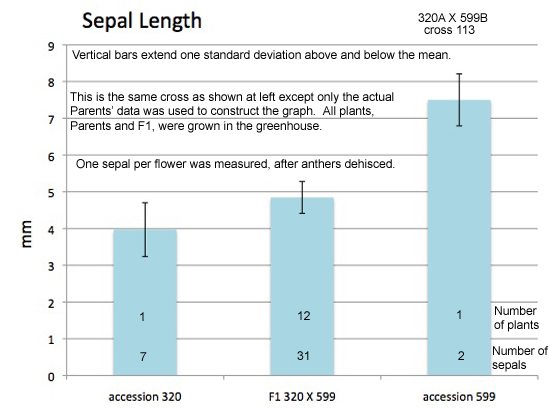
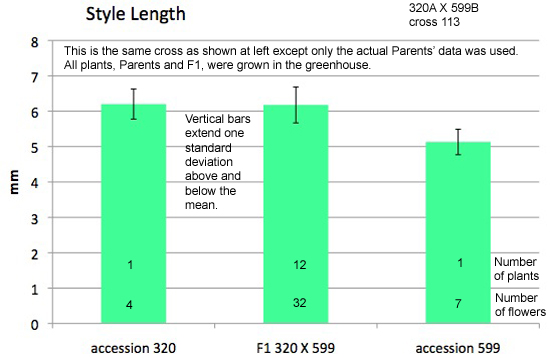
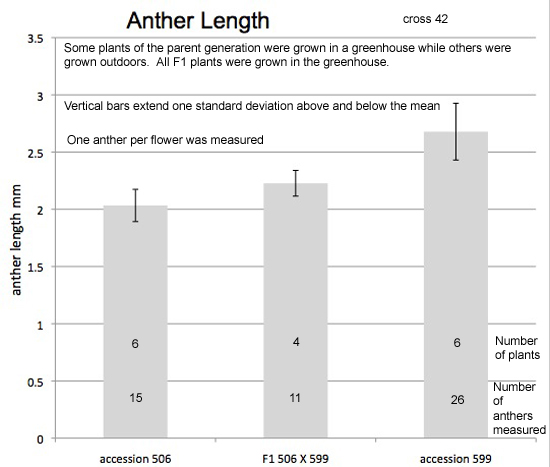
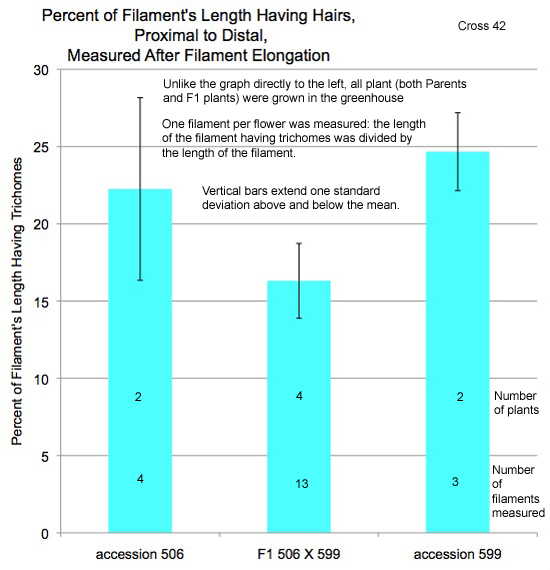
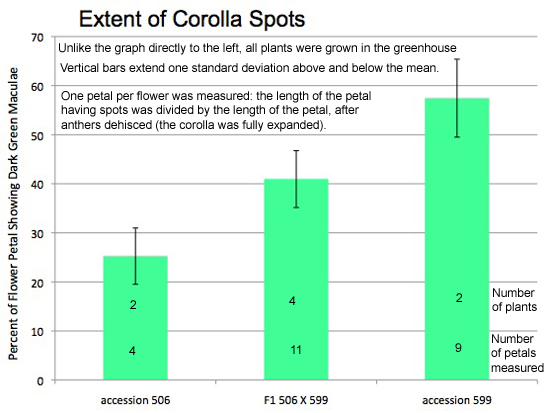
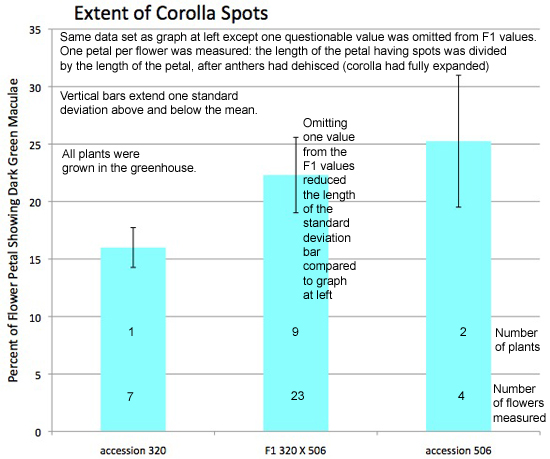
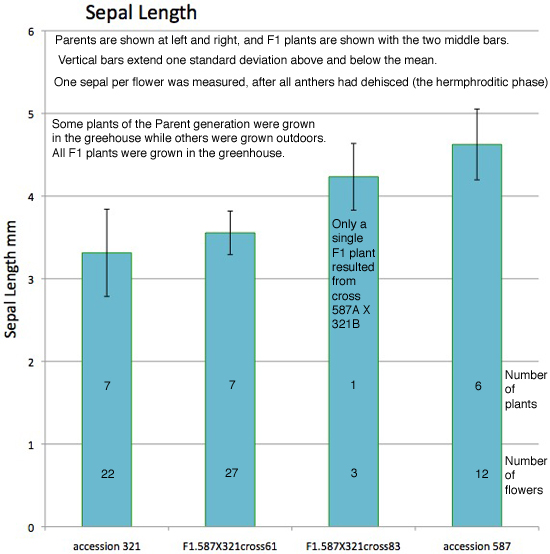
Above: This graph differs from the one directly to the left by including only the genetic parents used in the cross that generated the F1 plants.
Genetics Of Floral Characters, Jaltomata procumbens |
revised 20 Jan 2015 |
| Link to Jaltomata homepage | The information on this page may be cited as a communication with professor Thomas Mione, Central Connecticut State University, Biology Department, Copernicus Hall, 1615 Stanley Street, New Britain, CT 06050-4010 USA |
Link to the webpage showing graphs of the variation among accessions used in the Parent generation of this study. |
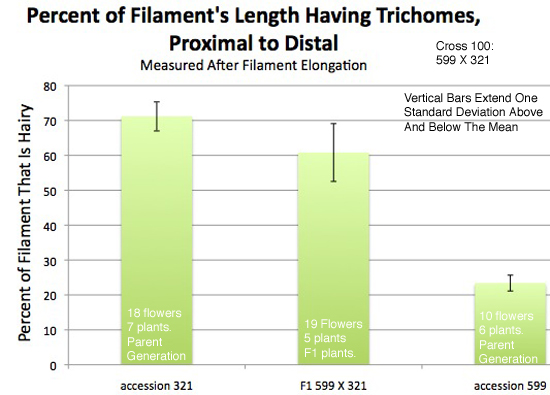
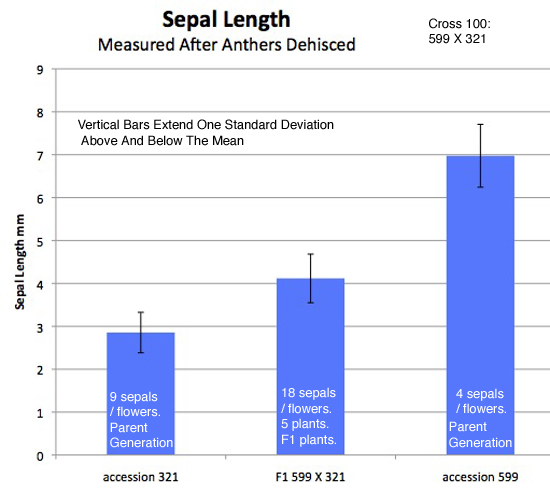
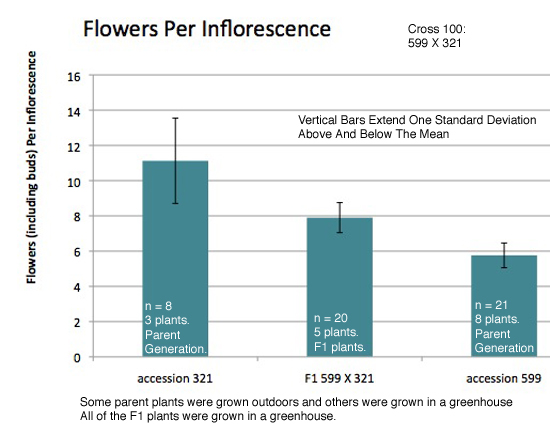
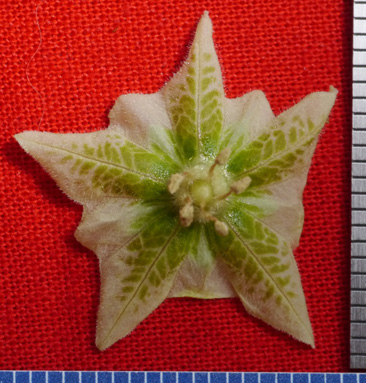
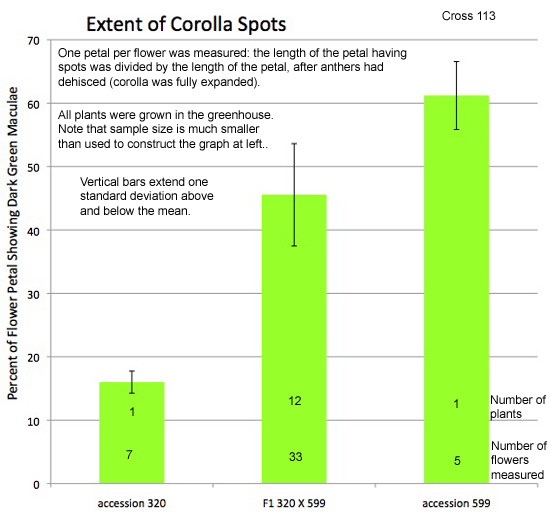
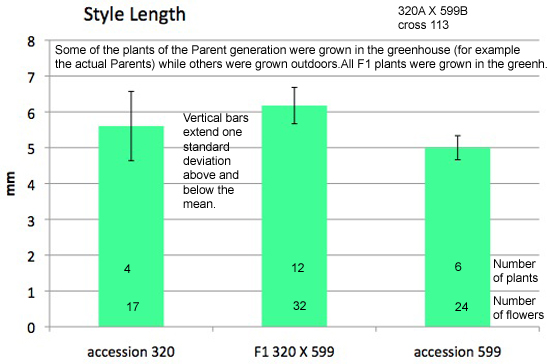
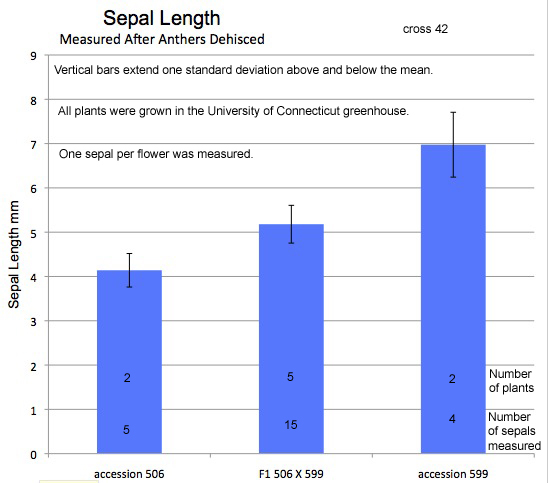
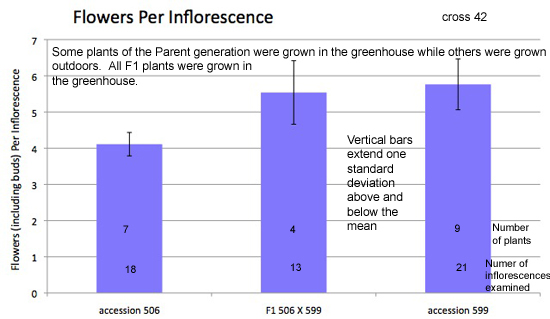
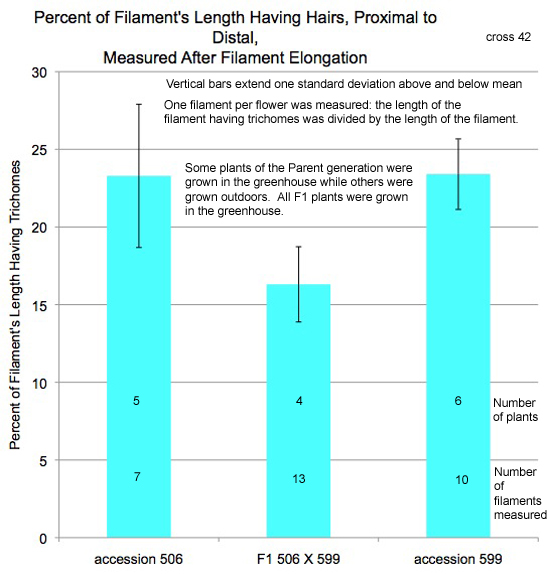
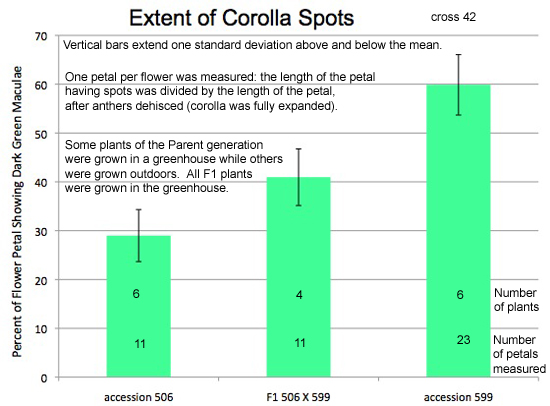
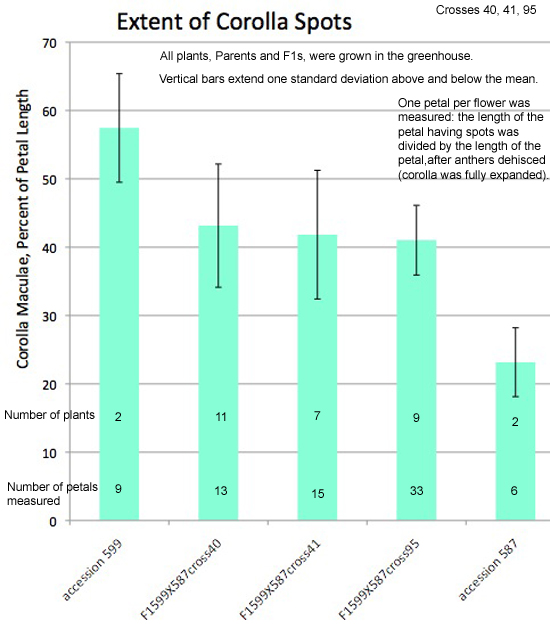
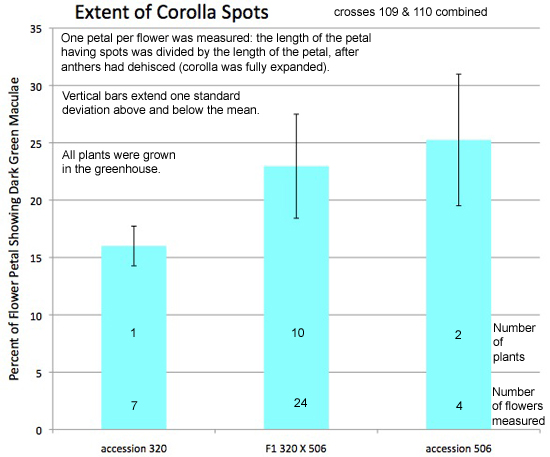
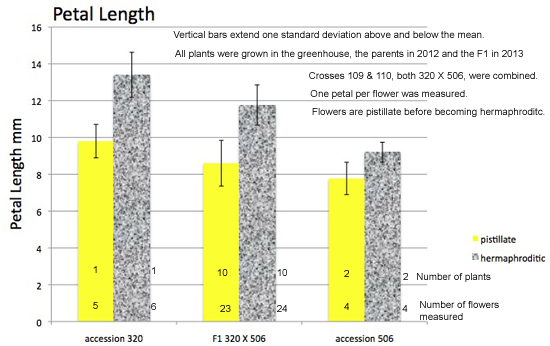
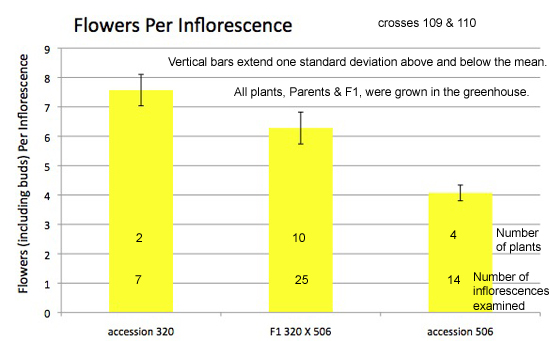
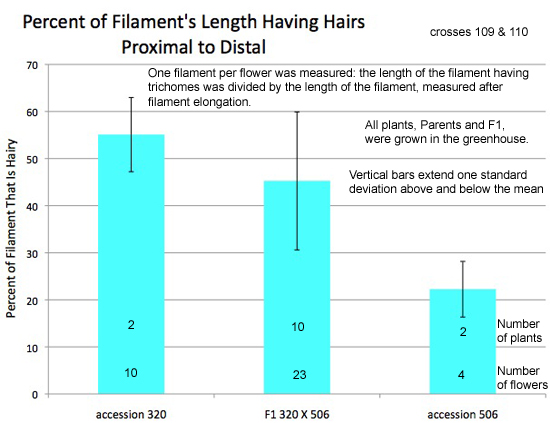
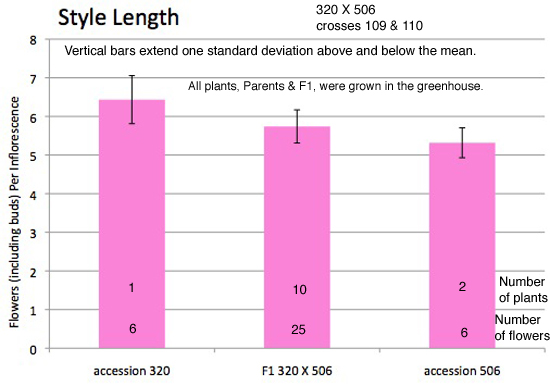
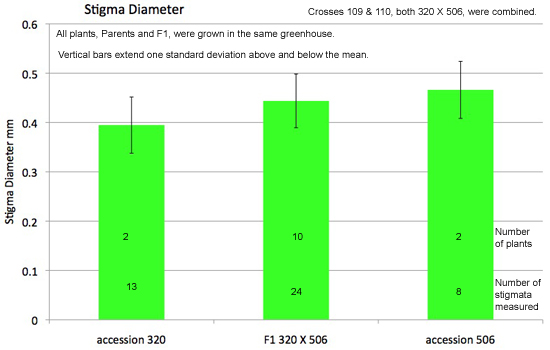
Materials & Methods. Plants of each Parent race were grown in each of three different environments, as follows: Plants A & B (two plants), were grown in the University of Connecticut greenhouse. Two plants, C & D, were grown in the outdoor garden of the University of Connecticut. Two to three plants, E, F and sometimes G, were grown outdoors in planting boxes in New Britain, CT. In 2013 and 2014 plants were grown only in the greenhouse, almost entirely at the University of Connecticut, Storrs. Parent plants were manually hybridized: Flowers receiving pollen were open, but anthers had not yet dehisced, and were emasculated at the time of pollination. Thus, flowers providing pollen were in a later developmental stage than flowers receiving pollen. Some of the crosses resulted in fruit-set. The crosses done at the University of Connecticut greenhouse were in a pollinator-free environment. Morphological characterisitics were measured on the parent plants (2012), F1 plants (2013) and F2 plants (2014). Flowers per inflorescence includes buds and pedicel scars. Sepal length was from the base of the pedicel to the lobe tip, gently flatened to the ruler. Petal length was from the androecium to the lobe tip, flattened to the ruler. The extent of darker green corolla spots was recorded as (the length of the petal having spots) divided by (the length of the petal) X 100. Anthers were removed for measuring, placed horizontally on a contrasting color on the stage plate. Each measurement (petal length, sepal length, stamen hairiness, etc.) comes from one flower. Stamen hairiness was recorded as (length having hairs including expanded base, mm) divided by (length of the filament including expanded base, mm) X 100; each stamen was removed and placed on a metric ruler for this (Figure below). Stigmata were measured in greatest dimension while the style was horizontal on the microscope's stage plate. Measurements of stigmata and anthers were recorded in ocular units on a microscope having a fixed magnification (the consistency of the calibration was checked: 0.0825 mm per ocular unit in 2012 when the study was starting, and again at the end of data aquisition in 2014). |
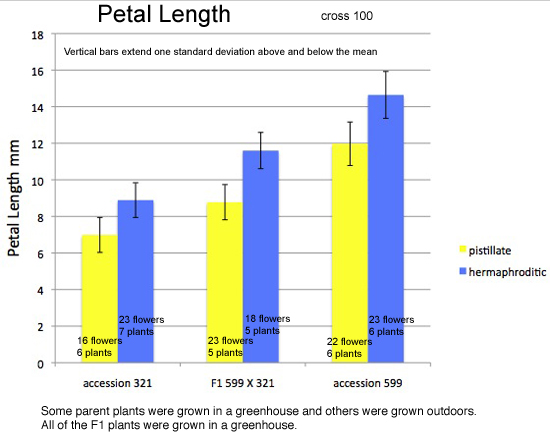
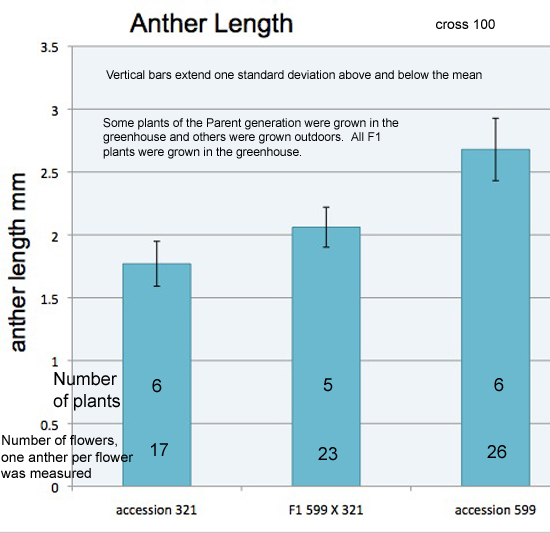
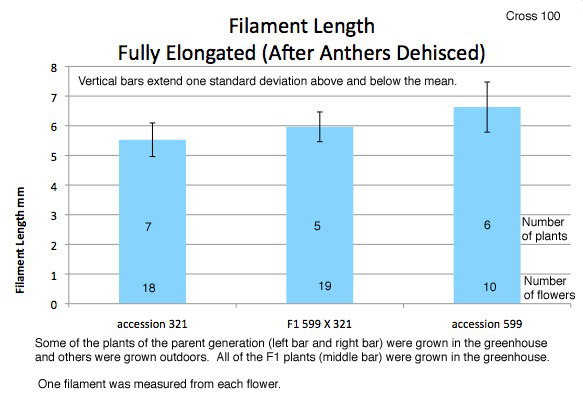
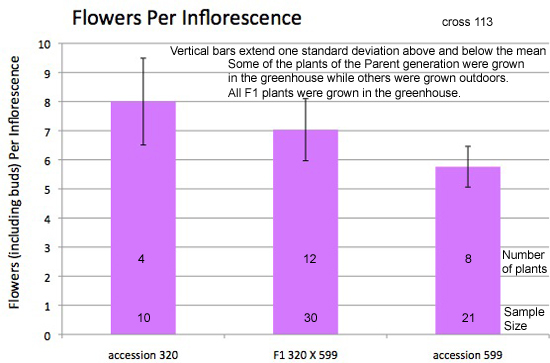
Results: The following group of graphs shows comparisons of Parents and F1 hybrids (cross 100: accession599 plant A X accession321 plant B). |
|
|
|
|
|
|
|
|
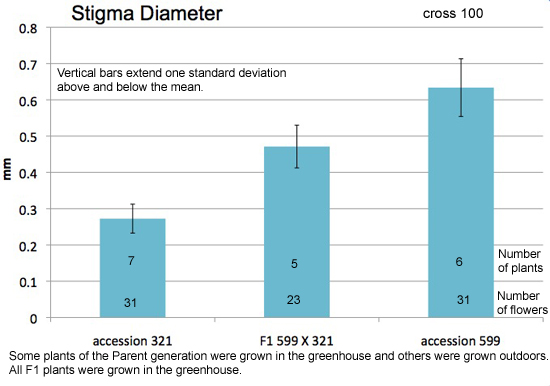
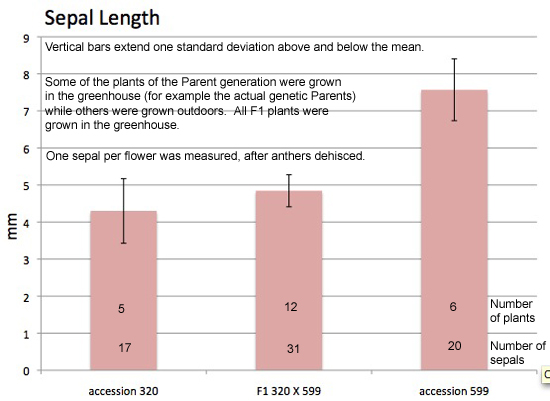
| Above: This graph differs from the one to the right of it by having a greater sample size for measurements made in the Parent generation, shown in the bars at left and right. For example, there were seven different plants of accession 321, and 6 plants of accession 599, grown and measured in year 2012. Some of the Parent plants of each accession were grown in the greenhouse and some were grown outdoors. | Above: This graph differs from the one directly to the left by including only the genetic parents used in the cross that generated the F1 plants.
|
|
|
|
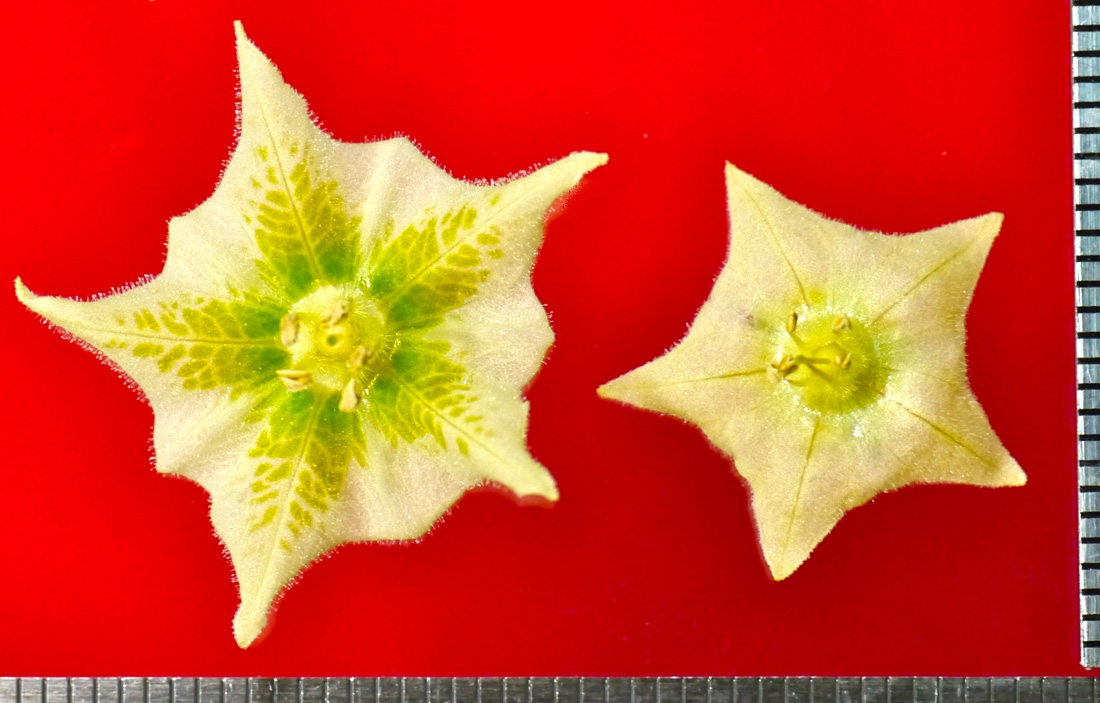 |
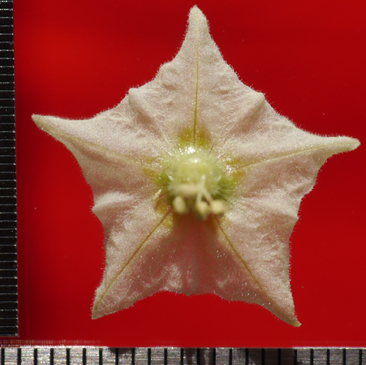
Above: Flowers from two different F2 plants grown from seeds set by the same F1 plant (from cross 100: 599 plant A X 321 plant B). On right: Smaller flower, and corolla maculae are on the proximal part of the corolla only. Units along bottom and right are mm. Photo by Gabriella Moreno in the laboratory of T. M. On left, F2 plant 3 - 4, in other words plant 4 from self-pollination of F1 plant 3; on right, plant 3 - 53, in other words plant 53 from F1 plant 3. |
 |
 |
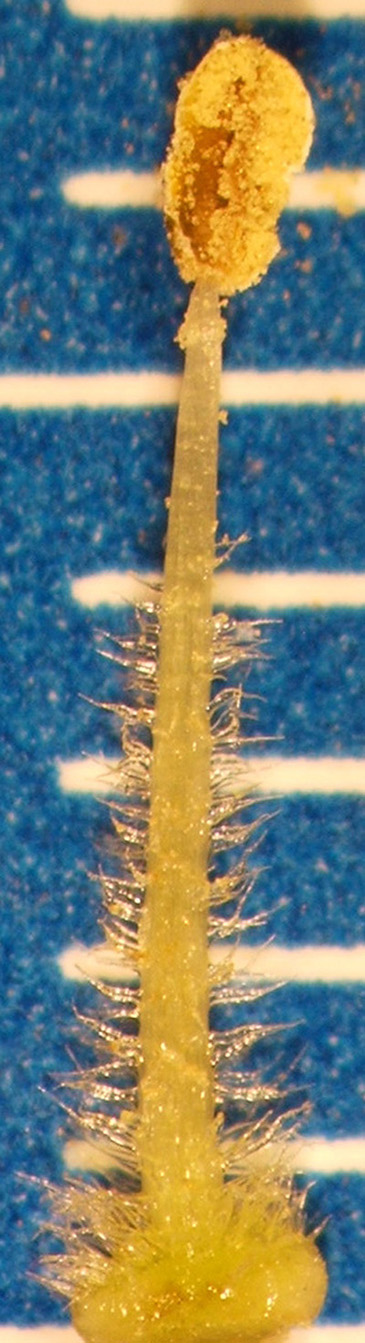 |
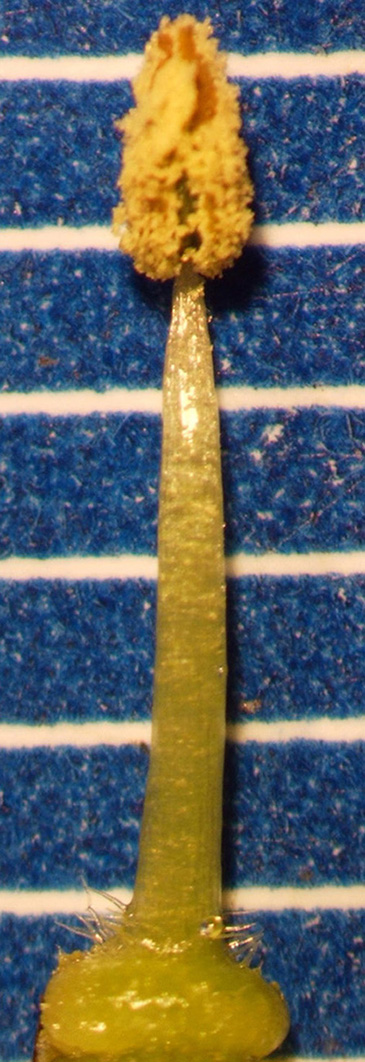
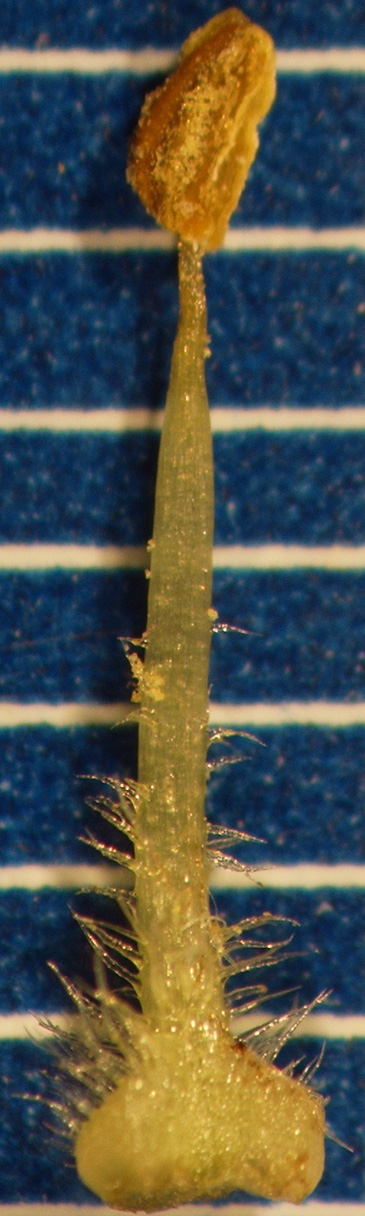
Above: Among F2 plants there was marked variation in the hairiness of the stamens, measured as the percent of the filament's length (including the expanded base) having hairs (cross 100: parent 599 plant A X parent 321 plant B). The data for the left filament was recorded as 1 mm (length having hairs) divided by 5 mm (length of the filament) X 100. The data for the middle filament was recored as 3.6 mm (length having hairs) / 6.2 mm (length of the filament) X 100. In practice, anthers were removed prior to measuring, but were left in place for the these photos. On left, plant 18, from self-pollination of F1 plant 5; also known as F2 plant 5-18. Middle stamen, plant 4 from self-pollination of F1 plant 3; also known as F2 plant 3-4. Photo by Michael J. Hastings in lab of T. M. On right, plant 28, from self-pollination of F1 plant 4; also known as plant F2 4-28. Photos on left and right by Thomas Mione, on top of a metric ruler. |
 |
 |
 |
Above: Flowers from different F2 plants from the same cross. In practice, to measure a petals it was gently flattend to a metric ruler. For consistency, the extent of the green spots (maculae) was measured after filaments elongated and anthers dehisced. Middle photo: Corolla spots extend slightly more than half way out to the corolla lobe's tip. Units along bottom and right are mm. F2 plant 5 - 14, in other words plant 14 from self-pollination of F1 plant 5. Photo by T. M. Photo on right: Corolla spots extend most of the way out to the corolla lobe's tip. Units along bottom and right are mm. Photo by Michael Hastings in the laboratory of T. M. F2 plant 3 - 4, in other words plant 4 from self-pollination of F1 plant 3. cross 100: 599 plant A X 321 plant B |
 |
 |
 |
 |
 |
 |
 |
 |
 |
 |
 |
 |
 |
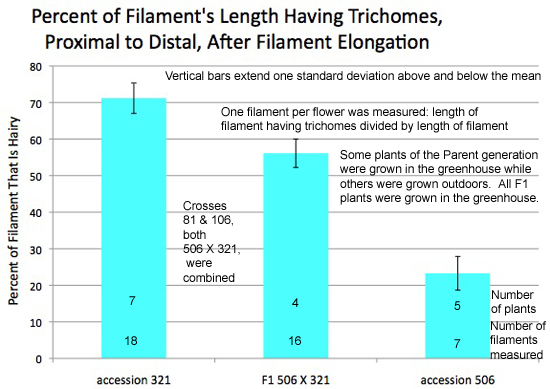 |
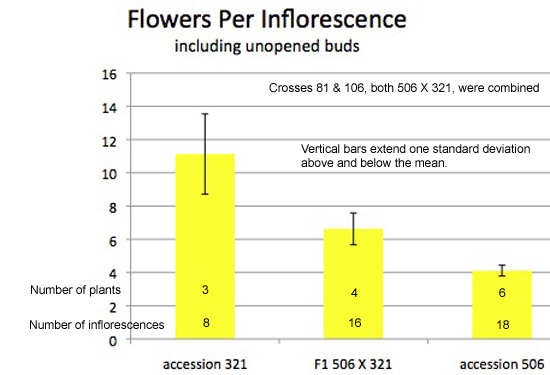
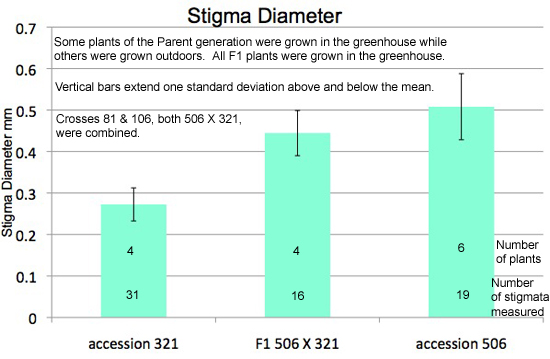
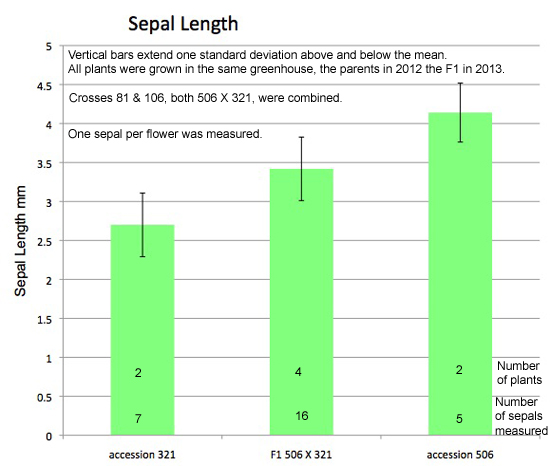
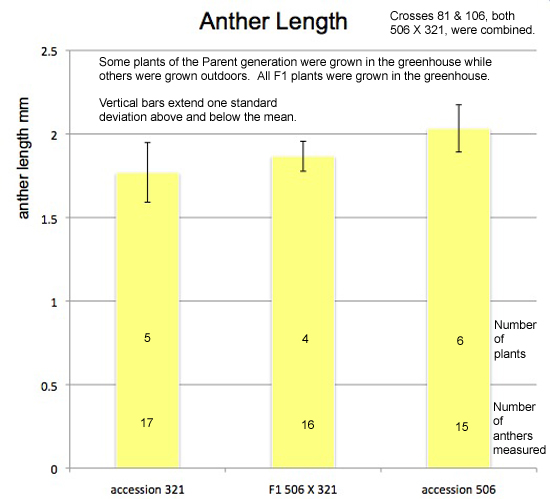
This group of five graphs shows a comparison of Parents and F1 hybrids, crosses 81 (accession506 plantA X accession321 plantB) and cross 106 (accession 506 plantA X accession 321 plantA) done in the University of Connecticut greenhouse. Parents were grown and hybridized in year 2012, and the F1 plants were grown in 2013. Only two seeds germinated from each cross, giving a total of four F1 plants. |
 |
 |
 |
 |
 |
 |
 |
 |
 |
|
 |
 |
|---|---|
 |
 |
 |
 |
 |
 |
|